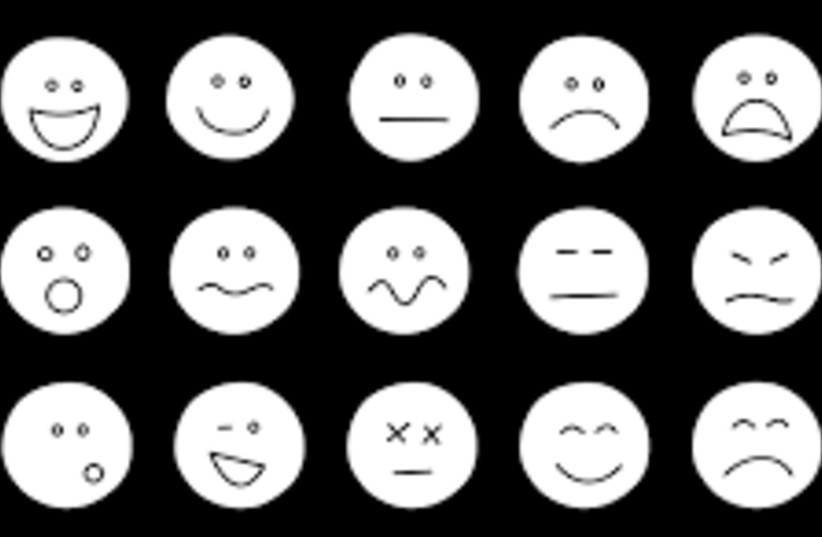
Researchers used data from Open Street Map and Twitter to highlight how factors such as different days, locations and points of interest locations could affect people's emotions in London and San Francisco.
The study was published in PLOS One, a peer-reviewed open-access scientific journal published by the Public Library of Science.
“Neural Network classifiers for fine-grained emotions were developed, tested and used to detect emotions from tweets in the two cites,” the researchers write in the study. “The detected emotions were then matched to key locations extracted from Open Street Map.”
A neural network is a series of algorithms that replicate the learning process of a human brain. They are comprised of a series of parameters, also referred to as neurons, that take one or more inputs to generate outputs. The outputs are then automatically used as inputs for another parameter in the network. The process continues until the terminal parameter generates the final output.
While previous research has used social media to determine analyzing users’ emotions, it has focused on very basic, general human reactions. Previous research has, for example, looked at posts in ways such as does a post express generally positive or negative emotions? and is happiness expressed in some way?

This study, however, examined human emotionality in a much higher resolution. It looked at seven emotions: Anger, anticipation, disgust, fear, trust, joy and sadness.
The tweets used for analysis in the Neural Networks were chosen by being geotagged by their human creators.
The study’s authors chose to focus the study solely on San Francisco and London for a few major reasons. These cities had a large volume of geotagged tweets, Open Street Map is overall more reliable in densely populated areas, and most of the data was available in English.
In this way, Twitter and Open Street Map were used in tandem, complementary roles in the Neural Network classifiers.
“Data from Open Street Map was collected and used to represent the spatial characteristics of the city, while data from geotagged tweets were analyzed and used to represent the emotions of people within the city,” the researchers explain in the study.
What were the most common emotions?
The result revealed that the most frequent emotion expressed in tweets was joy with 49.2% of tweets in San Francisco and 49.5% of tweets in London expressing this emotion. The percentages of the other emotions also mirrored one another between the two cities.
For San Francisco and London respectively, the percentages of tweets expressing anger were 3.1% and 3.8%, for disgust 5.5% and 5.9%, for anticipation 5.8% and 4.8%, for sadness 4.1% and 4.6%, for fear 3.7% and 2.8% and for trust 6.1% and 4.0%.
Daily averages of emotional prevalence shifted, particularly when certain events took place. For instance, on days that included an incident such as a protest or a terror attack, higher levels of anger, sadness and disgust were registered, whereas Christmas registered higher levels of joy.
Days of the week also reflected differences in expressed emotions. For example, there were higher levels of anger during the middle of the week than the weekend and Friday registered much higher levels of anticipation than Sunday.
Location also played an impact on the emotions that tweets expressed. Locations near water or where water activities could be engaged in showed high levels of joy. Conversely, transportation locations including train stations and bus stops were high in emotions such as anger and disgust.
As neural networks and AI continue to advance, it seems likely that the quality of people’s social media usage will continue to become more and more quantifiable. Furthermore, the study has interesting implications on how we are seeing machine learning being pertainable to human emotions.
